/percentage-charts · classroom
Percentage charts: conversions, hundred grids, percentage formulas
Make your ownPercentage charts
Describe yours. We'll remake the whole pack your way.
More like this
the whole catalog →
every sample — three subjects, three styles ↓
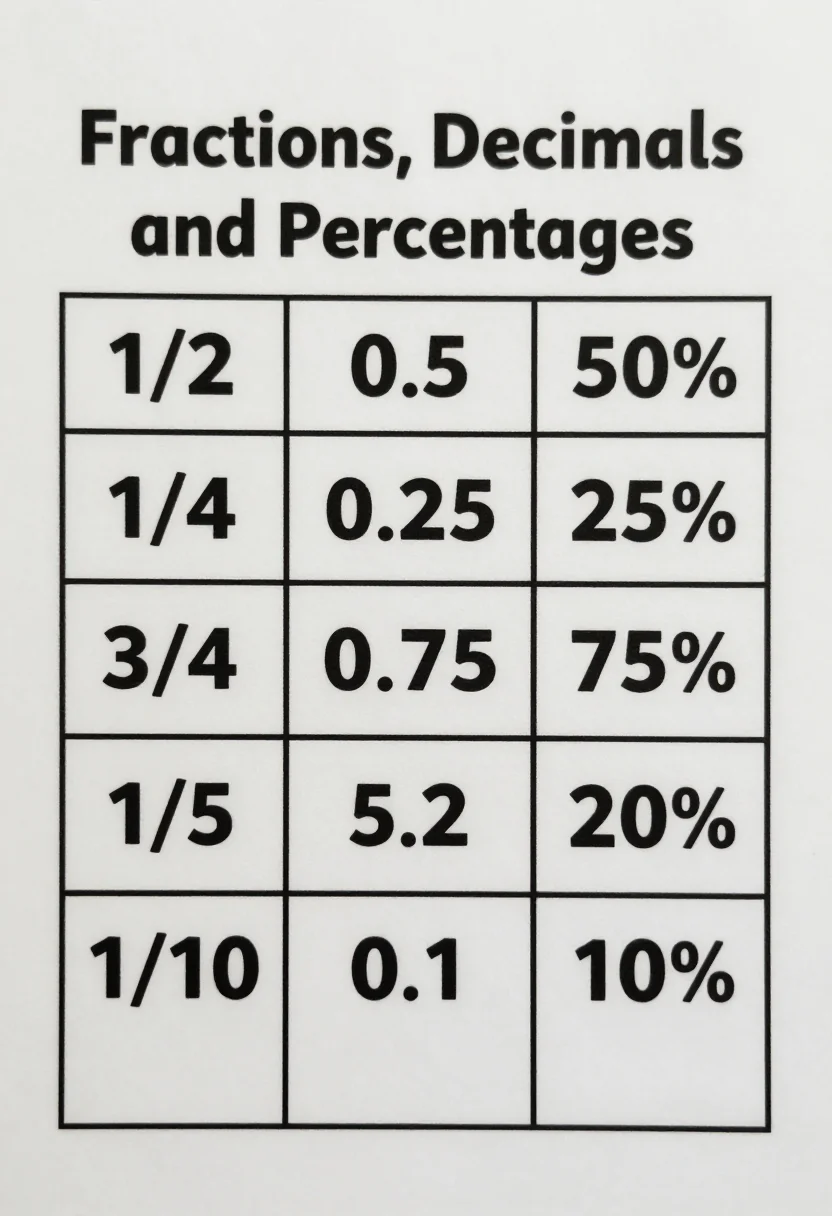
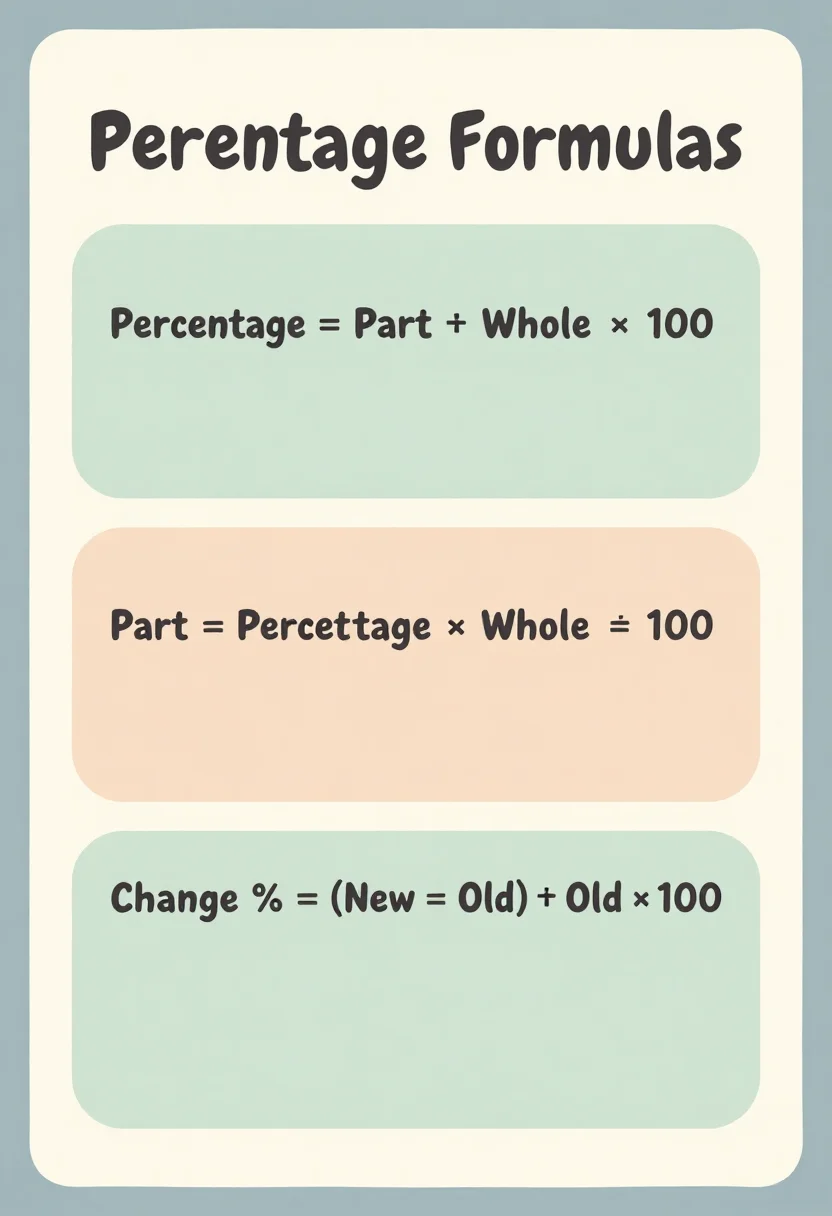
Printable percentage charts for students who convert between fractions, decimals and percents. One chart is a table of conversions such as 1/4, 0.25 and 25%. One shows four ten-by-ten grids shaded at 25, 50, 75 and 100 per cent, and one lists three formulas for percentage, part and change. Students keep them in a maths folder. Type a direction such as discounts or pie charts, and the chart is drawn for it.
- a reference chart in a maths folder
- a conversion table for a test
- a lesson on percent grids
- a formula sheet for percentage change
Frequently asked questions
- Which conversions are in the table?
- One half, one quarter, three quarters, one fifth and one tenth, each shown as a fraction, a decimal and a percentage.
- What do the shaded grids show?
- Ten-by-ten grids with 25, 50, 75 or 100 squares shaded, each labelled with its percentage.
- Which formulas are on the chart?
- Percentage, part and change in percentage, each in a boxed rule.
- Can I change the subject?
- Yes. Type a direction such as discounts or to 200% and the chart is drawn for it. It is a request, not a guaranteed result.
About toile
This page is a showcase and a starting point: nine samples already rendered, three readings of the pack crossed with three styles, each shown at the size and ratio it was made for. Take any of them further on the wall with a few words, or ask for all nine again under your own direction; a sign-in keeps what you make, and it is free while Toile is new. The recipe behind each sample — the subject, the style, the palette, the framing — travels with the image rather than staying private to the render: it is in the alt text of every sample and in the page's own structured data, so a search engine reads the same handles a person would.