/savings-challenge-charts · planner
Savings challenge chart: 52-week challenge, savings jar, goal thermometer
Make your ownSavings challenge charts
Describe yours. We'll remake the whole pack your way.
More like this
the whole catalog →
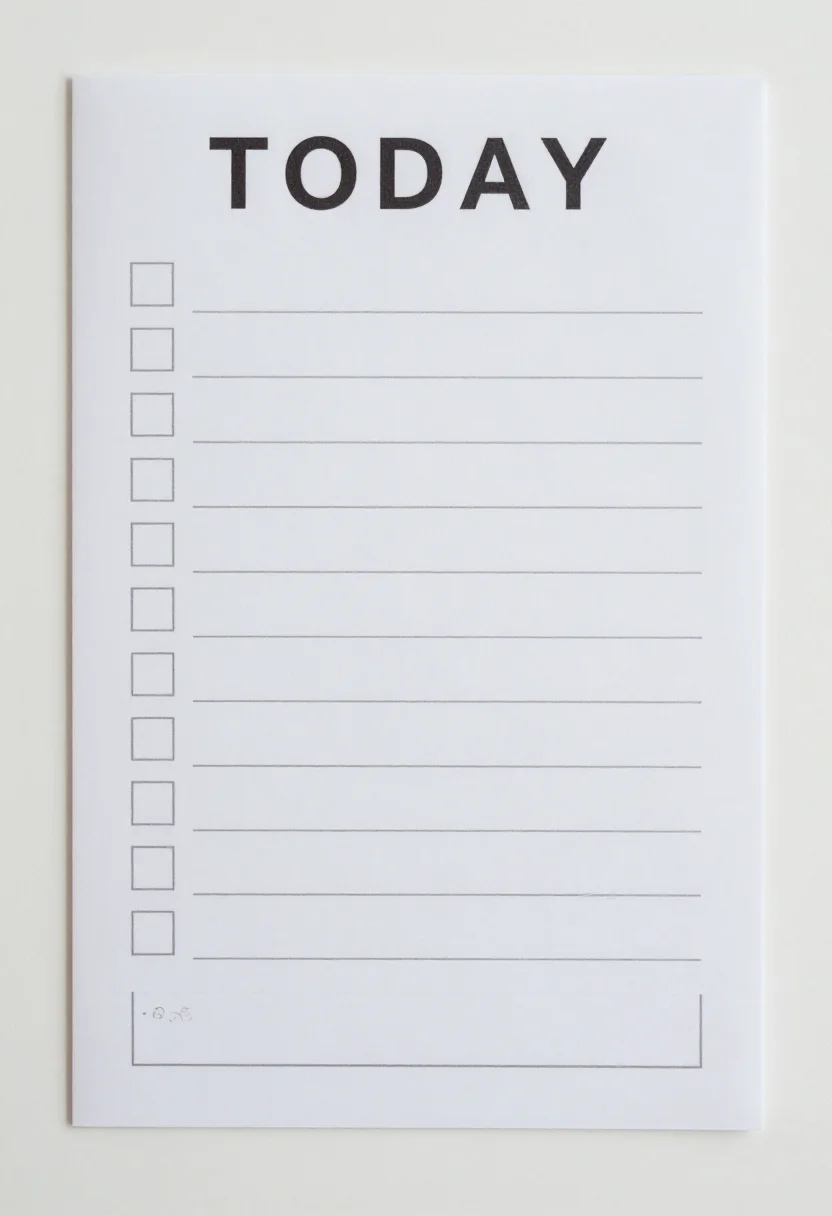
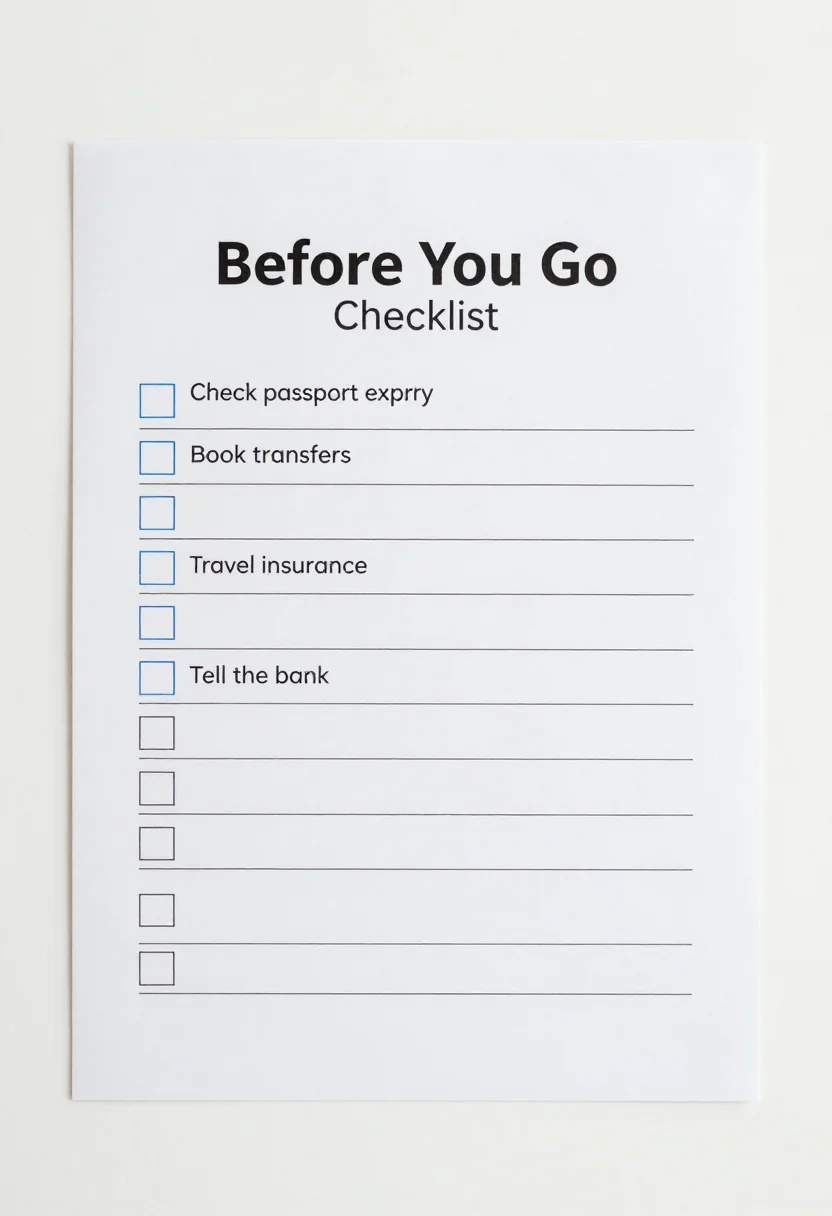
every sample — three subjects, three styles ↓
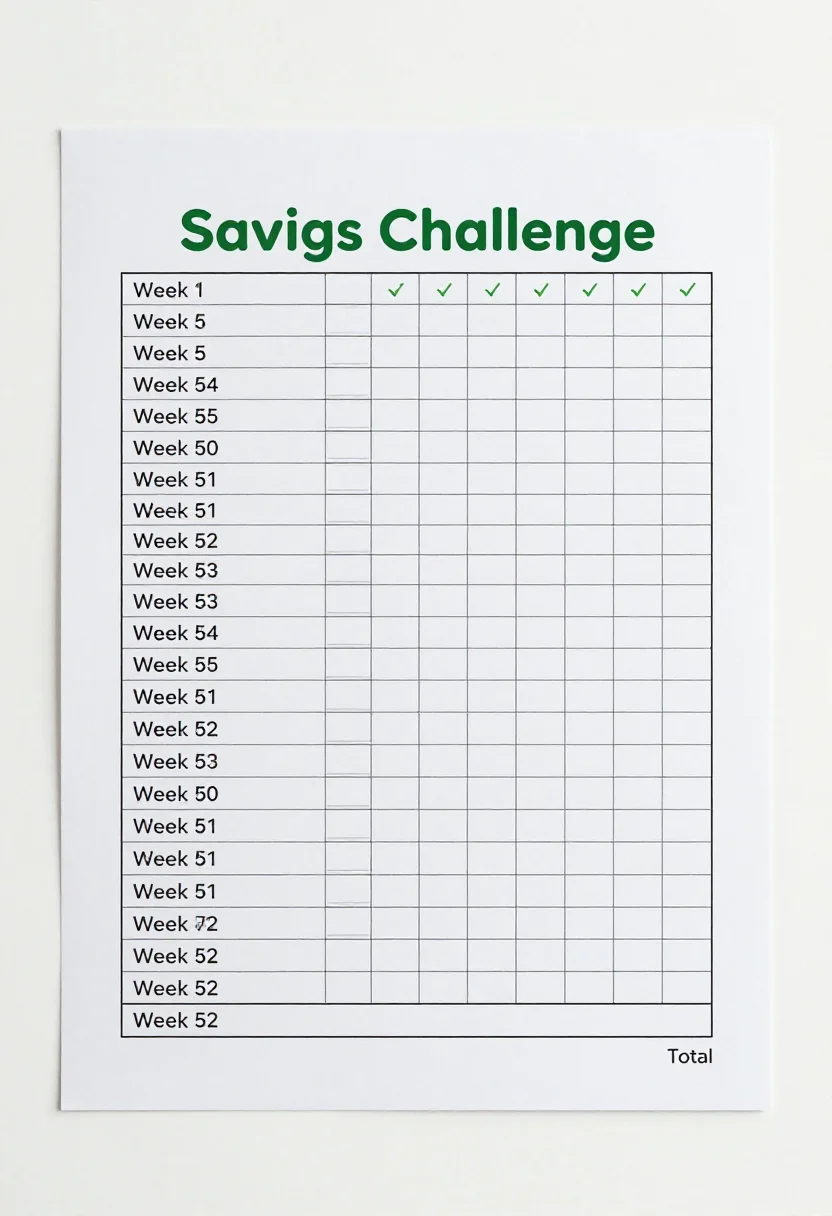
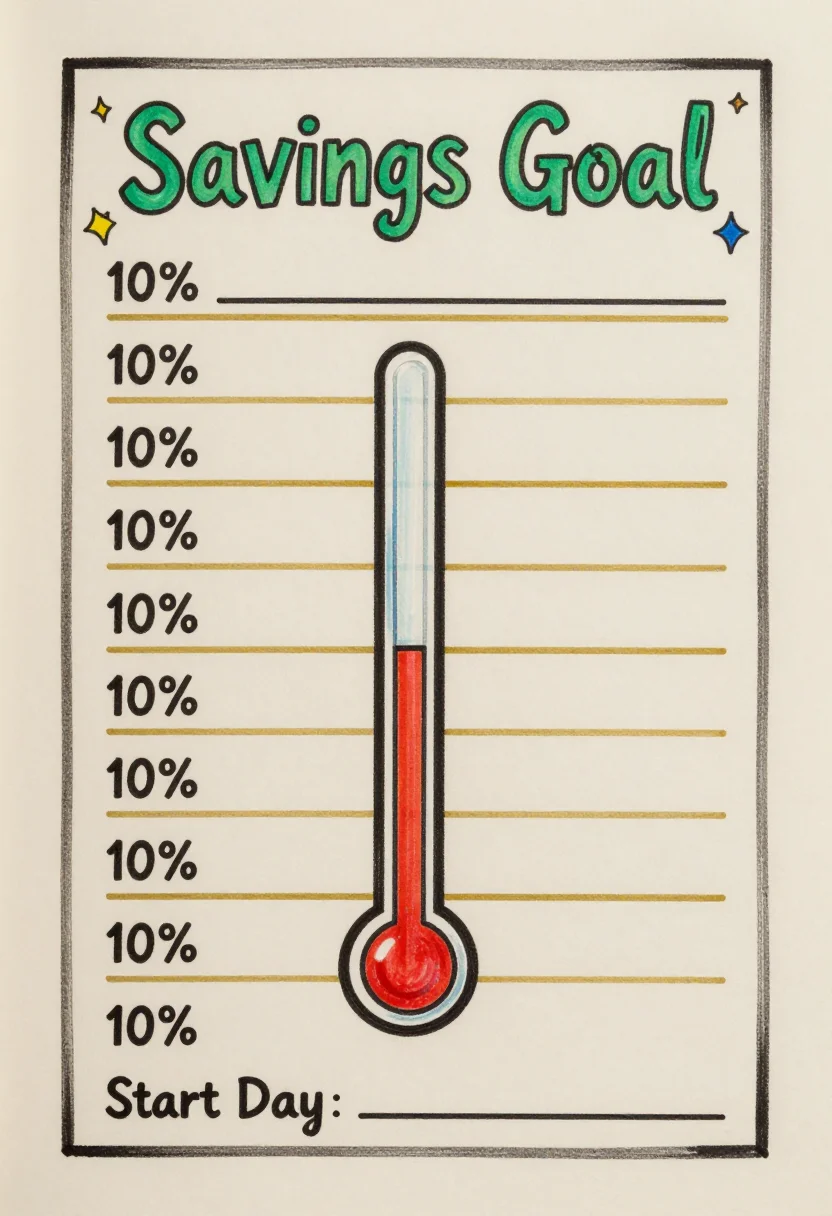
A savings challenge is a chart you colour in each time you put money aside, so the goal shows as it fills. These nine show three charts: a 52-week table with a box for each week, a money jar with a hundred circles to colour, and a goal thermometer marked from 10 to 100 per cent. The goal, the start date and the amounts are left blank. Type a direction, such as holiday fund, and the charts follow it.
- a family savings goal on the fridge
- a classroom money lesson
- a holiday or wedding fund
- a visible goal on a desk
Frequently asked questions
- How does the 52-week challenge work?
- It is a table of 52 numbered rows, each with a deposit column and an empty tick box, so you write the amount for each week and tick it off.
- What is the difference between the three styles?
- Clean minimal has thin black lines and a crisp sans-serif title. Soft pastel uses rounded boxes in muted pastels. Hand-drawn has wobbly marker outlines and a bubbly heading.
- Can I change the goal?
- Yes. Type a direction such as emergency fund or wedding fund. A direction is a request, not a guaranteed result.
About toile
This page is a showcase and a starting point: nine samples already rendered, three readings of the pack crossed with three styles, each shown at the size and ratio it was made for. Take any of them further on the wall with a few words, or ask for all nine again under your own direction; a sign-in keeps what you make, and it is free while Toile is new. The recipe behind each sample — the subject, the style, the palette, the framing — travels with the image rather than staying private to the render: it is in the alt text of every sample and in the page's own structured data, so a search engine reads the same handles a person would.