/sources-of-energy-charts · classroom
Sources of energy chart: renewable, non-renewable and saving energy
Make your ownSources of energy charts
Describe yours. We'll remake the whole pack your way.
More like this
the whole catalog →
every sample — three subjects, three styles ↓
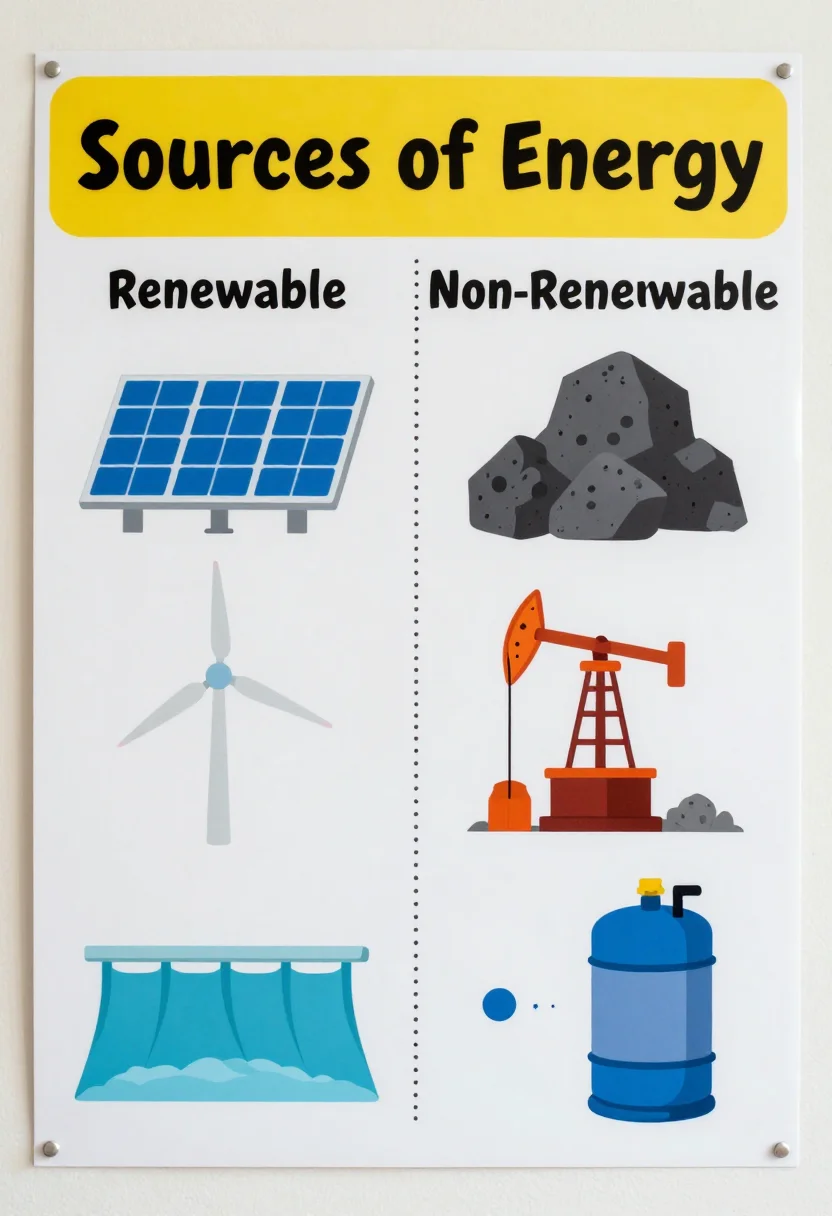
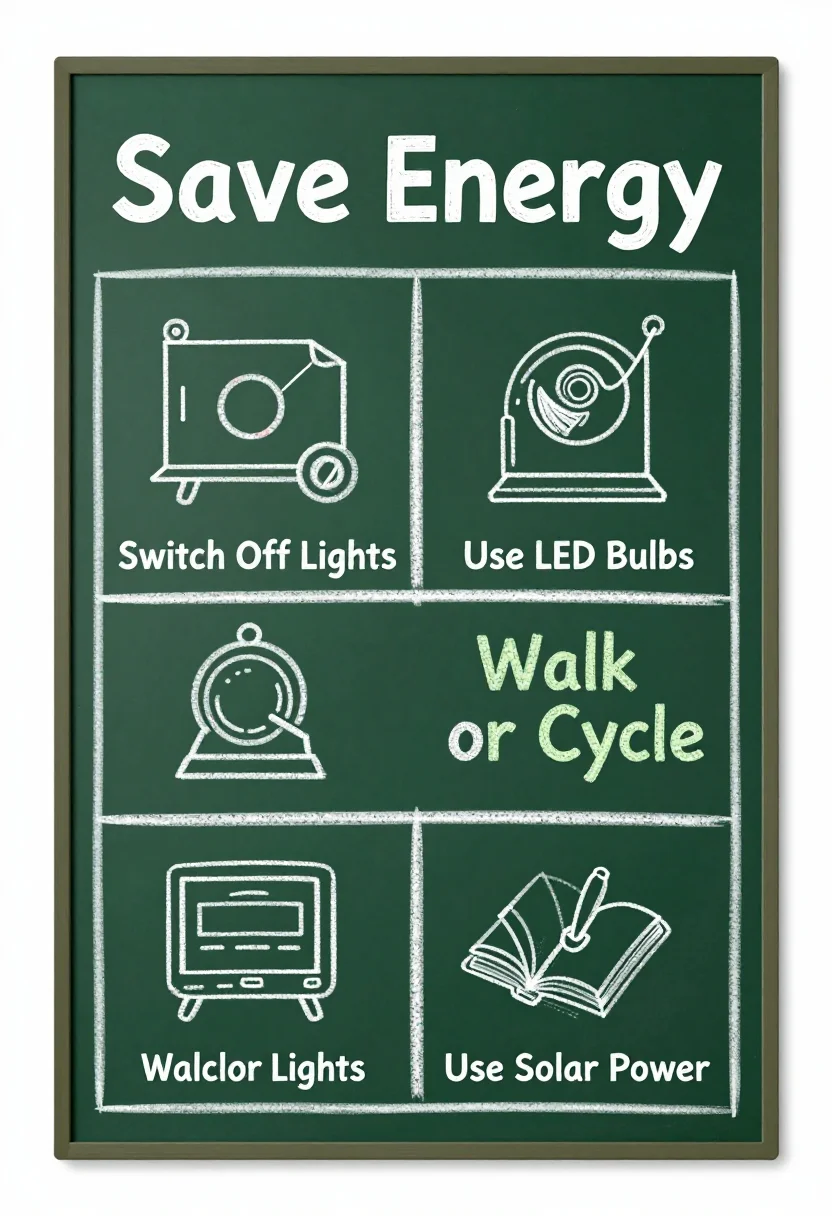
The sources of energy chart is a class 10 science project and a favourite in energy-saving week. The nine pictures show renewable and non-renewable sources side by side, the renewable sources around a large sun, and four ways to save energy. Ask for one source, such as solar power or wind turbines, and the same styles carry it.
- class 10 science project
- energy-saving week display
- classroom wall on renewable energy
- school assembly poster
Frequently asked questions
- What is on the chart?
- Renewable and non-renewable sources side by side, the renewable sources around a sun, and four ways to save energy.
- Which renewable sources are shown?
- Solar, wind, hydro, biomass and geothermal.
- Can I ask for one source?
- Yes. Type a direction such as solar power, wind turbines or fossil fuels. It is a request for a new chart, not a guaranteed result.
- Is the chart ready to print?
- The page is vertical, with a clean margin and no watermark.
About toile
This page is a showcase and a starting point: nine samples already rendered, three readings of the pack crossed with three styles, each shown at the size and ratio it was made for. Take any of them further on the wall with a few words, or ask for all nine again under your own direction; a sign-in keeps what you make, and it is free while Toile is new. The recipe behind each sample — the subject, the style, the palette, the framing — travels with the image rather than staying private to the render: it is in the alt text of every sample and in the page's own structured data, so a search engine reads the same handles a person would.